Medicare vs Commercial: Your Hidden Benchmark Gap
“United pays low.”
“Blue is fine.”
“Aetna is the worst in our market.”
And sure, sometimes that’s true. But a lot of the time it’s not a payer problem. It’s a benchmark problem.
More specifically, it’s a Medicare vs commercial benchmark gap. A quiet one. The kind that sits inside your contract language, your fee schedule spreadsheets, your EOBs, and your “we’ve always been paid like this” assumptions.
It shows up like this:
- You negotiate commercial rates using last year’s commercial rates as the anchor.
- You compare payers to each other, but not to Medicare. Or you compare to Medicare… incorrectly.
- You use “% of Medicare” casually, without checking whether your internal Medicare baseline is actually accurate for your location and code mix.
- You look at averages, not distributions.
- You ignore modifiers, place of service, facility vs professional, and the fact that your “benchmark” may not match what’s actually being adjudicated.
Then you sign a contract renewal and wonder why revenue still feels… stuck.
This post is about finding that hidden gap, why it matters, and how to close it with clean benchmarking using Transparency in Coverage data, not vibes.

The two most common benchmarking mistakes (and why they’re so expensive)
Mistake #1: Treating Medicare like a “floor” instead of a measuring tool
Medicare gets talked about like it’s a minimum. Like it’s the lowest payer and everything else floats above it.
But in contracting, Medicare is useful because it’s standardized. Not perfect, but standardized enough to help you measure commercial plans that are not standardized at all.
If you don’t measure, you can’t see the gap.
And the gap is usually not “payer A is 10% lower than payer B.”
It’s “payer A is 45% below what we thought, because our benchmark was wrong.”
Mistake #2: Comparing commercial to commercial without a neutral anchor
Practices often benchmark like this:
- “Payer A pays $X for 99213”
- “Payer B pays $X+10”
- therefore “Payer B is good”
But if both are low, the comparison just hides it.
It’s like comparing two bad offers and picking the better one. You still lose, just slightly less.
A neutral anchor, typically Medicare, helps you see if your whole commercial book is drifting down over time. And yes, that happens, especially when you don’t renegotiate often, or you renegotiate using the wrong baseline.
In such scenarios, understanding different contracting models becomes crucial. For instance, learning about the CIN vs Messenger Model could provide valuable insights into how these models can affect your benchmarking and overall reimbursement rates.
“% of Medicare” is simple. Until it isn’t.
People love saying “we’re at 140% of Medicare.”
And that can be a good shorthand. But only if everyone in the room means the same thing.
Because “% of Medicare” can silently mean a bunch of different calculations:
- Medicare Physician Fee Schedule (PFS) national vs locality adjusted
- Professional vs facility rate assumptions (huge difference for many codes)
- A conversion factor year change (your contract might reference an older year)
- RVU based method vs dollar based method
- A code set that includes things Medicare doesn’t cover or pays differently
- A mix of modifiers where the effective allowed amount changes
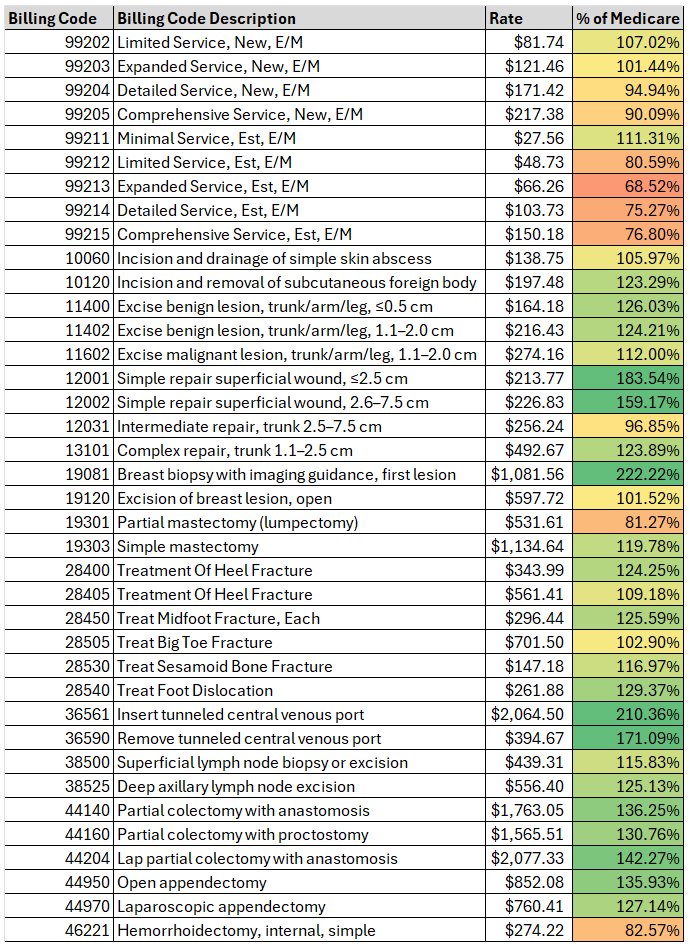
So yes, you can be “at 140%” in a spreadsheet and still be underpaid in reality. Because the spreadsheet is comparing the wrong thing. Below is an example showing one surgery practice’s negotiated rates by % Medicare for a few commonly billed surgery codes. It is not uncommon to see variation like this across practices, regions, and specialties.
Understanding Medicare’s Role
It’s essential to grasp how Medicare’s Physician Fee Schedule operates. This knowledge will not only help avoid common benchmarking mistakes but also ensure better negotiation outcomes with commercial payers by providing a reliable reference point.
The hidden benchmark gap: where it actually lives
When we say “hidden,” we mean that it’s not obvious from your top line revenue. You can be growing in visits and still have a widening gap. You can be “busy” and still be leaking.
Here are the most common places it hides.
1) Your Medicare baseline is outdated (or misapplied)
Even practices that actively track Medicare often use:
- a single year’s fee schedule and keep it forever
- national rates when locality rates apply
- facility rates when you’re billing non facility (or vice versa)
- the wrong place of service assumptions
One wrong column in the spreadsheet and every commercial comparison is off.
2) Your commercial “benchmark” is just your current contract
This is the big one.
If your internal benchmark is “what we get paid now,” then negotiations become circular:
- payer offers 2% increase
- you counter for 5%
- you settle at 3%
- everyone pretends it’s a win
But if your current rates were already 25% behind market, you just locked in being behind market again. With a 3% bow on top.
3) You’re using averages that smooth out underpayment
Averages hide pain.
If a payer is strong on a few primary care codes but weak on procedures, imaging, or ancillary codes, the average can look fine. Meanwhile, some of your most profitable services are getting squeezed.
You need code level benchmarking. Not a blended “overall reimbursement seems okay.”
Quick reality check: Medicare vs commercial is not a single number
Commercial rates can be:
- 110% of Medicare on evaluation and management
- 160% on procedures
- 90% on certain diagnostics
- 250% on one niche code that the payer uses as an access incentive
- and then randomly low on another code because of some legacy fee schedule artifact
So when someone says “we’re at 150%,” you should ask:
150% of Medicare… for what codes? In what setting? Weighted by volume? With what modifiers? In what geography? For which payer product?
It’s not being picky. It’s the difference between real leverage and false confidence.
Why this gap wrecks your negotiation leverage
Payers negotiate like this:
- They assume you do not know market rates.
- They assume you will negotiate from your last contract.
- They assume you will bring anecdotes, not data.
- They assume you will accept “we’re already above Medicare” as a win.
When you don’t have a credible benchmark, you end up negotiating in a fog. And the payer is not in a fog. They know what they pay others. They also know what their competitors pay. You don’t.
So the benchmark gap becomes a leverage gap.
And then it becomes a revenue gap.
A simple way to spot the gap in your own practice (without fancy tools)
This is not perfect, but it’s a start. Pick:
- 10 to 20 of your highest volume CPT codes (or highest revenue codes)
- for your top 2 commercial payers
- in the most common place of service (office, outpatient hospital, etc.)
Then pull:
- Your current contracted in network amounts (fee schedule if you have it, otherwise infer from EOBs).
- Your Medicare allowed amounts for the same codes, same setting, same locality year.
Now calculate:
- Payer allowed / Medicare allowed = % of Medicare, code by code
What you’re looking for:
- big inconsistencies (why is 99213 at 155% but 93000 at 92%?)
- codes where you assumed you were strong but you’re not
- codes with high volume where you’re quietly underwater
- payers where your spread is weirdly wide, often a sign of legacy rate tables
If you do this and feel a little sick, yeah. That’s usually the moment the gap becomes visible.
The Transparency in Coverage twist: commercial “rates” are visible now, but still messy
Transparency in Coverage (TiC) changed the game, at least on paper.
Commercial payers now publish machine readable files with negotiated rates. That means market benchmarking is possible at scale.
But. And this is a big but.
TiC data is not instantly useful to an independent practice because:
- files are enormous
- rate schemas vary by payer
- provider identifiers can be tricky (NPI, TIN, facility vs group)
- code descriptions and rate types don’t always map cleanly to how you bill
- geography and product lines matter
- you can drown in data and still not answer the one question you actually have
- “Am I underpaid compared to my market for my specialty?”
This is exactly where most practices get stuck. They know the data exists. They just can’t turn it into leverage without spending enterprise money.
What a “real” Medicare vs commercial benchmark should include
If you want the benchmark to hold up in a negotiation, it needs a few qualities. Not 50. Just the essentials.
It should be specialty aware
A cardiology practice does not need the same benchmark lens as behavioral health or orthopedics. Code mix matters.
If your benchmark report treats all CPTs equally, it’s not a contracting tool. It’s trivia.
It should be code level, not just “overall”
You negotiate specific codes, specific services, and sometimes specific fee schedule sections.
If your benchmark can’t show where you are weak, you can’t ask for targeted fixes. And targeted fixes are often easier for a payer to approve than a blanket increase.
It should show market ranges, not just a single number
Negotiated rates are distributed. There are lows, medians, highs.
A payer will often tell you “your rate is competitive.” That might be true if you’re at the 45th percentile.
But if you’re a high demand specialty in a tight network, “competitive” is not the right goal. You may have a defensible ask at the 70th percentile. Or higher.
It should be easy to explain to a payer, fast
If your benchmarking output takes 30 minutes to explain, you will lose the room.
You want something you can drop into an email or a slide:
- here’s our current rate
- here’s the market range
- here’s Medicare baseline for reference
- here’s our requested adjustment
- here are the codes and why they matter
How the gap shows up differently by practice type
A few patterns that come up again and again.
Primary care
Often decent E/M relative to Medicare, but gaps in:
- preventive services nuances
- office procedures
- care management codes
- payer specific edits that reduce effective allowed
Also, primary care groups sometimes accept “we’re above Medicare” as the only yardstick. That’s where the hidden gap survives.
Specialty practices
More likely to have:
- strong rates in some procedure families
- terrible rates in others
- and a big gap between payers that nobody notices because revenue is still “fine”
Specialists also tend to have higher leverage than they realize, especially in markets with access issues. Benchmarks help you prove it.
Behavioral health
Rates can be all over the place, and payer policies matter as much as fee schedules. The gap often shows up when you compare:
- individual therapy vs group
- diagnostic evals
- telehealth parity patterns
- payer specific caps and reductions
Ancillary heavy practices (imaging, testing, etc.)
Site of service, TC/26, and facility vs professional splits can make benchmarks misleading if you don’t control for them.
This is where a sloppy Medicare comparison can absolutely steer you wrong.
“We’re at 160% of Medicare.” Cool. Are you also 40% below market?
This is the part that surprises people.
In some markets and specialties, it’s possible to be:
- meaningfully above Medicare
- and still under the commercial market median
Because the market can be 220% for certain high demand services, or because certain competitors negotiated better years ago and you never caught up.
So Medicare is not the finish line. It’s the ruler.
You still need market context.
Closing the gap: what actually works (practically)
There are a lot of negotiation tactics out there. Scripts, templates, “say this to the payer” stuff. Some of it helps.
But the thing that consistently changes outcomes is boring:
Bring credible benchmarks, and make them specific.
Here’s a workflow that is realistic for an independent practice.
Step 1: Identify your top payer pain points by dollars, not emotions
Pick:
- top 2 to 4 payers by volume or revenue
- top 20 to 40 CPT codes by volume and revenue (by specialty)
Step 2: Benchmark those codes against your market
Not against your last contract. Against the market.
This is where TiC data can help if it’s processed into something usable.
Step 3: Build a targeted ask
Payers resist across the board increases. But targeted adjustments can slide through more easily:
- bring weak codes up to median
- bring strategic codes up to a higher percentile if you have leverage
- fix obvious outliers that are indefensible
Step 4: Show the payer their own story
This is underrated.
When you can say:
- “Here’s where your rates sit compared to the market range”
- “Here’s the delta vs peer payers in this zip code”
- “Here’s the codes where you’re an outlier low”
…you shift the tone from confrontation to math.
Step 5: Repeat annually, even lightly
The gap widens when you ignore it for years. Even a small annual benchmark refresh keeps you from drifting.
Where Reveon Health fits in (and why it exists)
Most independent practices cannot justify enterprise transparency solutions. They’re priced and designed for health systems, giant MSOs, or consulting teams with data analysts on staff.
Reveon Health launched to close that exact access problem.
It takes the complexity of Transparency in Coverage data and turns it into specialty focused reimbursement benchmarks that a small practice can actually use in negotiations, without hiring a consultant or buying a six figure platform. This affordable enterprise-quality rate benchmark solution is specifically designed for practices like yours.
If you’re trying to answer questions like:
- “Are we underpaid compared to our local market for our specialty?”
- “Which CPT codes are the biggest outliers?”
- “Which payer is actually the worst once we normalize against Medicare and market ranges?”
- “What should we ask for in our next contract negotiation, specifically?”
That’s the lane.
You can learn more at https://reveonhealth.com and see how the benchmarking reports are structured, what’s included, and whether it’s a fit for your practice size and specialty.
A quick example scenario (this is usually how it plays out)
Let’s say a practice believes:
- Payer A is “good”
- Payer B is “bad”
- because Payer A pays $8 more on a common office visit code
They run a benchmark and learn:
- Yes, Payer A is slightly higher on E/M
- But Payer A is way below market on three high revenue procedure codes
- Payer B is actually closer to market median across the full code mix
- And both payers are far below where the practice thought they were, because the practice used an outdated Medicare baseline and averaged everything together
Now the negotiation changes.
Instead of asking Payer A for a blanket 10% increase (and getting ignored), they ask for targeted adjustments on the three procedure codes, with market range evidence.
That tends to get a real response.
Not always a yes. But a real response.
The takeaway (and the uncomfortable truth)
If you are not benchmarking commercial reimbursement properly, you can be:
- above Medicare and still underpaid
- “competitive” and still below the market median
- busy and still drifting backward
- renewing contracts and quietly locking in the gap
The Medicare vs commercial benchmark gap is not a theory. It’s a practical, fixable problem.
And the practices that fix it are usually not the biggest ones. They’re the ones that stop guessing.
If you want to stop guessing and see your market position with clarity, take a look at Reveon Health here: https://reveonhealth.com. It’s built for independent practices that need enterprise grade benchmarking without enterprise pricing.
That’s the whole point.
FAQs (Frequently Asked Questions)
What is the common misconception about payer problems in medical practice contracting?
Many practices believe their payer problem is simply that a specific insurer pays low rates, such as “United pays low” or “Aetna is the worst.” However, often the real issue is a Medicare vs commercial benchmark gap hidden within contract language, fee schedules, and assumptions, rather than an inherent payer problem.
Why is Medicare considered a crucial benchmarking tool rather than just a payment floor?
Medicare serves as a standardized baseline for measuring commercial plan reimbursements, which are highly variable. Treating Medicare as merely a minimum payment ignores its value as a neutral anchor that helps identify true gaps in commercial rates compared to expected benchmarks.
What are two common benchmarking mistakes that can lead to significant revenue loss?
The first mistake is treating Medicare solely as a floor instead of using it as a measurement tool. The second is comparing commercial payers only against each other without referencing Medicare as a neutral anchor. Both errors obscure the actual reimbursement gaps and can result in underpayment going unnoticed.
Why can stating reimbursement as “% of Medicare” be misleading?
Saying “we’re at 140% of Medicare” can be oversimplified because “% of Medicare” calculations vary widely depending on factors like national vs locality-adjusted Physician Fee Schedules, professional vs facility rates, year of conversion factor used, RVU-based vs dollar-based methods, code sets, and modifier mixes. Without consistent definitions, this metric can misrepresent true payment levels.
Where does the hidden benchmark gap typically exist within practice revenue data?
The hidden gap often lives undetected because it doesn’t always show in top-line revenue growth or visit volumes. It frequently stems from outdated or misapplied Medicare baselines (e.g., wrong year fee schedules or place of service assumptions) and using current contracts as internal benchmarks, which leads to circular negotiations and masked underpayments.
How can practices close the hidden benchmark gap effectively?
Practices should use clean benchmarking with Transparency in Coverage data rather than relying on assumptions or outdated spreadsheets. This includes accurately updating Medicare baselines for locality and place of service, using Medicare as a neutral anchor for commercial comparisons, understanding different contracting models like CIN vs Messenger Model, and carefully analyzing distributions rather than averages to identify true reimbursement discrepancies.